INSERT Tab on Excel 2016/Office 365

The Insert Tab is the one which has changed the most.
Here is a summary of the new features which can now be achieved using this Tab.
Table
Entering data and then creating a Table means you get sorting and filtering and design options as part of the deal. Simply type in your data and then click Table. See below for an example.
Headers and Footers
The process of inserting a header or and a footer hasn’t changed, but where you find it has. This option is now located under the ‘Text’ button on the far right hand side of the Insert Tab.
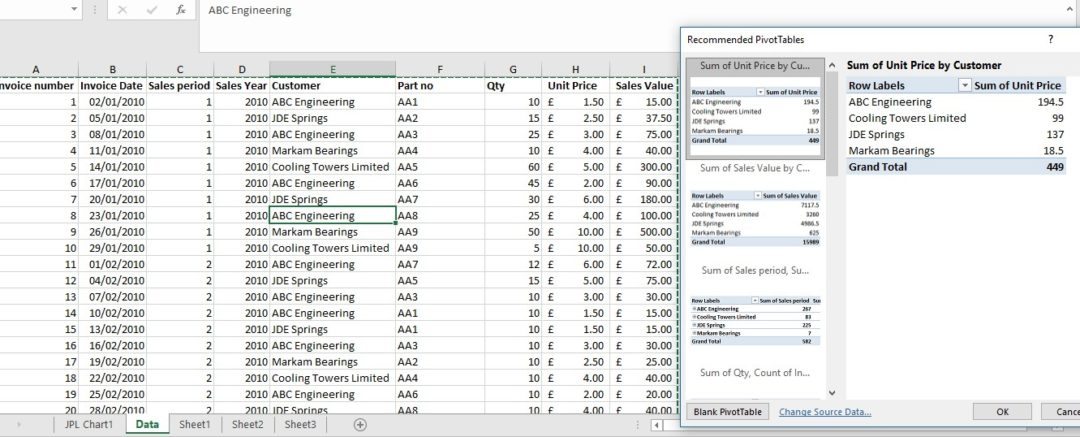
Recommended Pivot Tables
With this option you get some sample ready made Pivot Table layouts which may be suitable for your data. See below for an example.
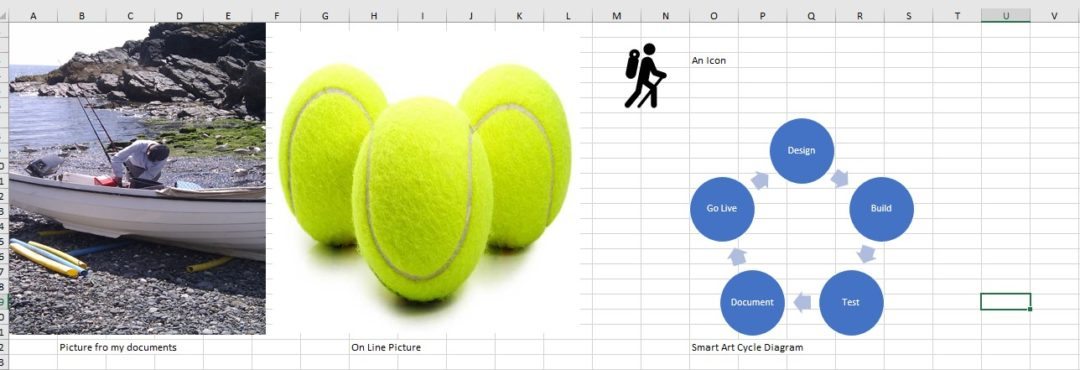
Illustrations
There are now several options to introduce colourful graphic/pictures into your worksheets. See below for an example.
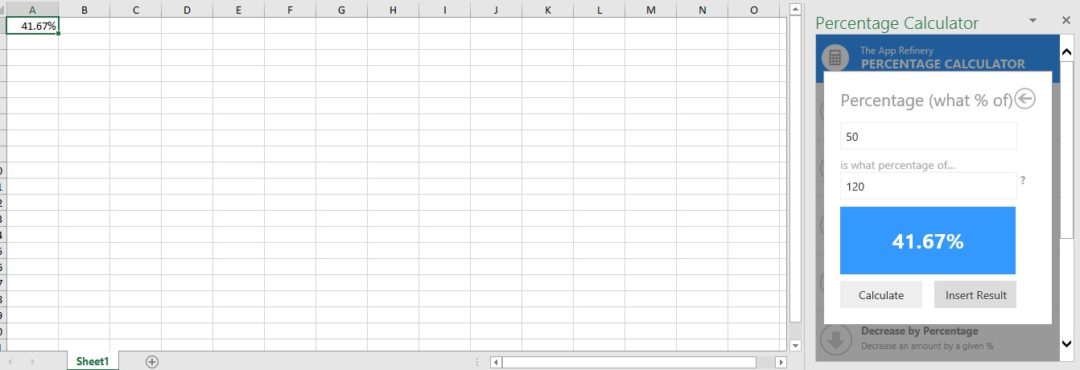
Add Ins
Store and Add ins lets you introduce a useful app to use in Excel. An example is the percentage calculator. Simply search the Store and Insert and Use. See below for the ‘What % of’ example.
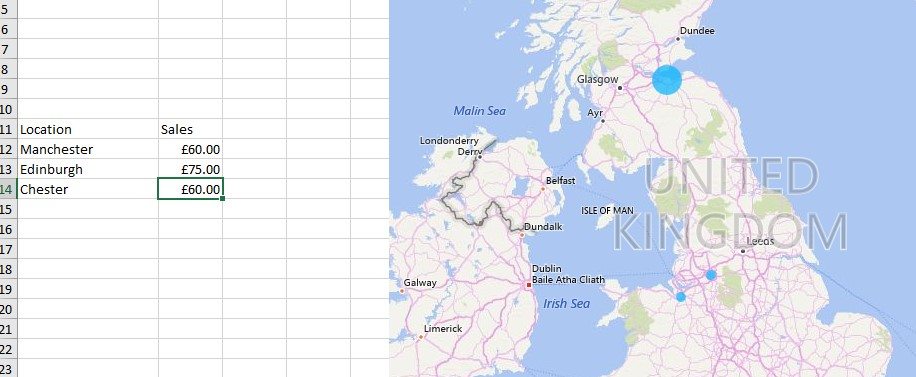
Bing Maps (Add Ins)
This allows you to see locations on a map with corresponding data. See below for an example.
Maps (Charts Section)
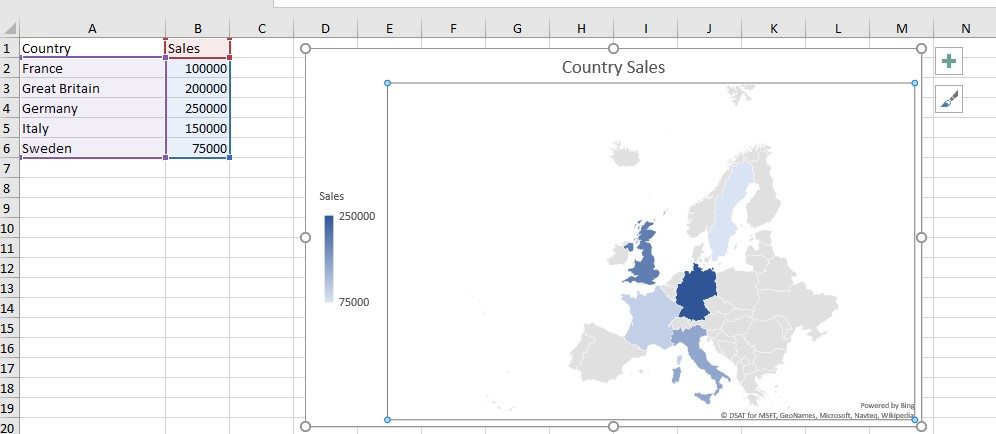
This allows you to see a map chart of your data. See below for an example.
3D Maps
This facility allows you to create a geographical tour in 3D on your data. See below for a simple example.
Here’s the Excel data:

Here’s the 3D map:
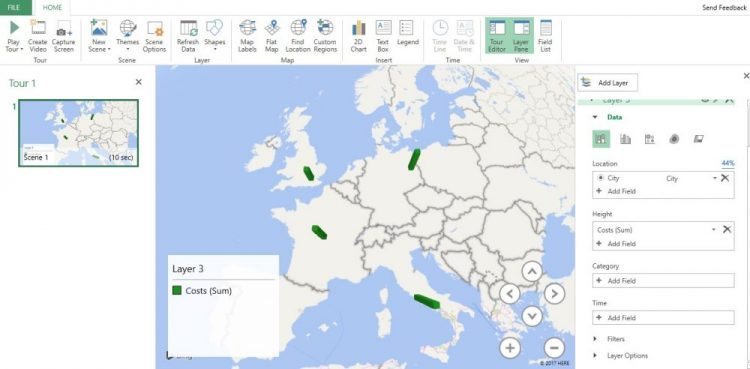 It can be get quite involved including creating a video of your tour.
Sparkline
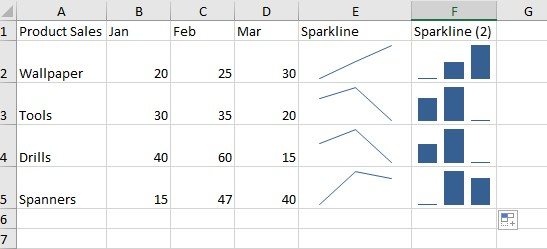
This feature allows you to create a sparkline (chart in a cell) of the data. See below for an example.
Slicers and Timelines in Pivot Tables
These features are an alternative to filtering. See below for an example.

We hope you’ve found this article useful, you might also like to read more about our Microsoft Excel training.
Why not take a look at our previous post on 17 tips in Word?


